The Sun as a Star


| Gene Smith's Astronomy Tutorial The Sun as a Star |
|
Solar Properties
Throughout history, humans have been aware of the importance of the Sun for life on Earth. Solar energy is transformed by plants into chemical energy, the first step in the food chain for all living things. Modern humans use energy from the Sun as a clean, inexpensive source of power. And, sunlight and solar magnetic activity affect the Earth's climate. The sun's unique importance is, however, one of proximity - it is in all respects a very middle class star.
| The Sun Compared with Other Stars | ||
|---|---|---|
| Property | Solar Value | Stellar Range |
| Luminosity | L = 4 x 1033
erg/s = 4 x 1033
erg/s |
106L -
10-3L |
| Mass | M = 2 x 1033
gm |
100(?)M - 0.085 M |
| Size | R = 7 x 1010 cm |
1000 R - 0.01 R |
| Density | <Density> = 1.4 g/cm3 | Water = 1.0 g/cm3 |
| Atmospheric Temperature |
5700 K | 2500 K - 45000 K |
| Magnetic Field | <B> = 1 gauss |
<B> ~ <Bearth> |
= luminosity of the Sun
= mass of the Sun
= radius of the Sun
= Sun's magnetic field strength
The Structure of the Sun
 |
The Photosphere
The region which produces the light that we see is the photosphere. The photosphere has a depth less than 500km (compared with the rest of the sun it is thinner than the skin of an onion). The temperature ranges from about 4500 K at the top of the solar atmosphere to 7500 K at the base. This region is where the solar absorption spectrum is produced; the photosphere effectively acts as a blanket of cooler gas which absorbs and re-emits radiation from the warmer regions below. The picture to the left was taken in the light of Hydrogen (Balmer) alpha at 6563Å on 26 January 1999. For a movie of the last 10 days of solar images follow this link.. |
|
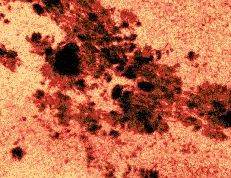
Sunspots are cooler regions in the solar photosphere where the
temperature may drop to a frigid 4000K. Magnetic studies of the sun show that
these are also regions of very high magnetic fields, up to 1000 times stronger
than the regular magnetic field.
Sunspots follow an 11 year cycle of formation that represents the cyclic variation in solar activity. The number of sunspots increases from zero at solar minimum, to over 100 at solar maximum, 5 1/2 years later. The position of the sunspots is not random. They first appear in the middle latitudes above and below the Sun's equator. As solar activity increases, the bands of sunspots widen and move toward the equator. The plot on the right below, known as a "butterfly diagram", shows the number and position of sunspots over time. |
 |
| High resolution images of the sun show patterns of solar granulation. Granuales are small structures approximately 1000 km across that cover the entire solar surface, except for the sunspot regions. They are the tops of deep gas columns where energy is transported by convection. Hot gases from the the solar interior expand upward, spreading out and cooling. The cool gas sinks back into the Sun, to be reheated and repeat the process. Spectra of the centers of the granules shows these regions to be a few hundred Kelvin hotter than the surrounding darker lanes. Individual granuales last for about 20 minutes. The gas within them can reach speeds of 7 km/sec (15,000 mph), faster than the speed of sound in air. |  |
|
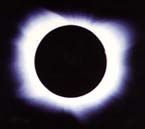
The Chromosphere The chromosphere is the region above the photosphere. It has a thickness of about 10,000 km and temperature ranging from 5000K near the boundary with the photosphere to several hundred thousand K at the upper boundary. (These boundaries are not well defined and the numbers cited for the thickness and temperature may vary.) The chromosphere is much fainter than the photosphere and is only visible during solar eclipses, when it can be seen as a pink flash with accompanying emission line spectrum. |
 The Solar Chromosphere during Eclipse |
| Bundles of magnetic field lines in the chromosphere outline the areas of granulation, and form a web-like pattern over the Sun. The chromosphere also shows bright areas of high-magnetic activity called plages, and filaments, dark, cooler areas of material suspended above the surface by magnetic loops. Filaments that are seen projecting out from the limb of the Sun are called prominences. Material is ejected from the chromosphere into the corona by small eruptions called spicules in which gas is forced upward, along the magnetic field lines.. |  High Altitude Observatory Image of the "Granddaddy" Prominence |
 |
The Corona The Solar Corona lies above the chromosphere, extending out to several solar radii and reaching temperatures as high as 2,000,000K. The corona is very diffuse, with only about 10 atoms/cm3 and is riddled with magnetic field lines. Open field lines lie above coronal holes where a stream of energetic particles, the solar wind, flows outward at speeds of 300--800 km/sec. Streamers and plumes of gas form along closed field lines, blown outward by the solar wind. |
Solar flares are explosive events on the solar surface characterized by intense brightening of regions of the solar atmosphere in x-rays, ultraviolet and visible light over periods of a few minutes, then fading over a period of an hour or so. During a flare high energy particles are ejected into the corona, heating regions to temperatures in excess of 5 million K. A flare may release an amount of energy equivalent to 100 million "hydrogen" (fusion) bombs.
The invention of the coronograph prompted the discovery of a solar phenomenon never before observed from Earth. A coronograph creates an artificial eclipse by covering the bright disk of the sun allowing study of the corona. Periodically, a huge cloud of gas with frozen-in magnetic field lines is ejected from the Sun over several hours. These clouds are called coronal mass ejections or CME's. They are sometimes associated with flares or prominences, but also occur alone. The number of CME's varies with the solar cycle, going from about 1 a day at solar minimum, up to 2 or 3 per day at solar maximum. CME's, like flares, disrupt the flow of the solar wind, and can cause wide-spread damage on Earth. Research is ongoing to understand the way in which CME's form, with the hope of being able to predict them. Space weather is of interest to communications and power companies, as well as the military. If CME's could be anticipated, it would be possible to shut-down satellites and minimize damage. Here is an MPEG animation of a coronal mass ejection.
The Solar Magnetic Field
The source of the sun's activity is believed to be the Solar Magnetic Field which can be seen in this 3-D visualization. The magnetic field structure of the Sun is very complex. Field lines are dragged and twisted by the Sun's differential rotation. Because the Sun is gaseous it does not rotate uniformly: the equator rotates more rapidly (25 days) than the polar regions (~30 days). Magnetic field lines near the surface inhibit convection and produce sunspots. When field lines shear,cross and reconnect, the huge amount of energy released heats the surrounding gas to millions of degrees, creating solar flares. The 11 year solar cycle is believed to be a cycle of twisting and reorganization of the magnteic field.
Solar Phenomena on Other Stars
If the sun is an "average" star it is reasonable to expect that solar-type phenomena occur in other stars. Although the sun's activity is quite spectacular to us, such activity is completely undetectable even on the nearest stars. But many solar phenomena exhibit themselve in grander fashion elsewhere.
![]() The H-R Diagram
The H-R Diagram
![]() Stellar Spectra
Stellar Spectra
![]() Education & Outreach
Education & Outreach
![]() CASS Home
CASS Home
Conducted by Gene Smith, CASS/UCSD.
Comments?
You may send email to hsmith@ucsd.edu
Prof. H. E. (Gene) Smith
CASS 0424 UCSD
9500 Gilman Drive
La Jolla, CA 92093-0424
Last updated: 16 April 1999